
Choose a suitable topic
The first step to a good infograhic is an appropiriate topic. Infographics are suitable for presenting complex information as an understandable and clear story. do you mainly want to show data? Then a fact sheet might be a better solution


Keep it simple
First, consider the purpose of your infographic. What is the key message and what do you want to achieve? Then choose the most important information you want to display and focus only on that. Too much information can make your infographic unattractive or unclear.

Write a story
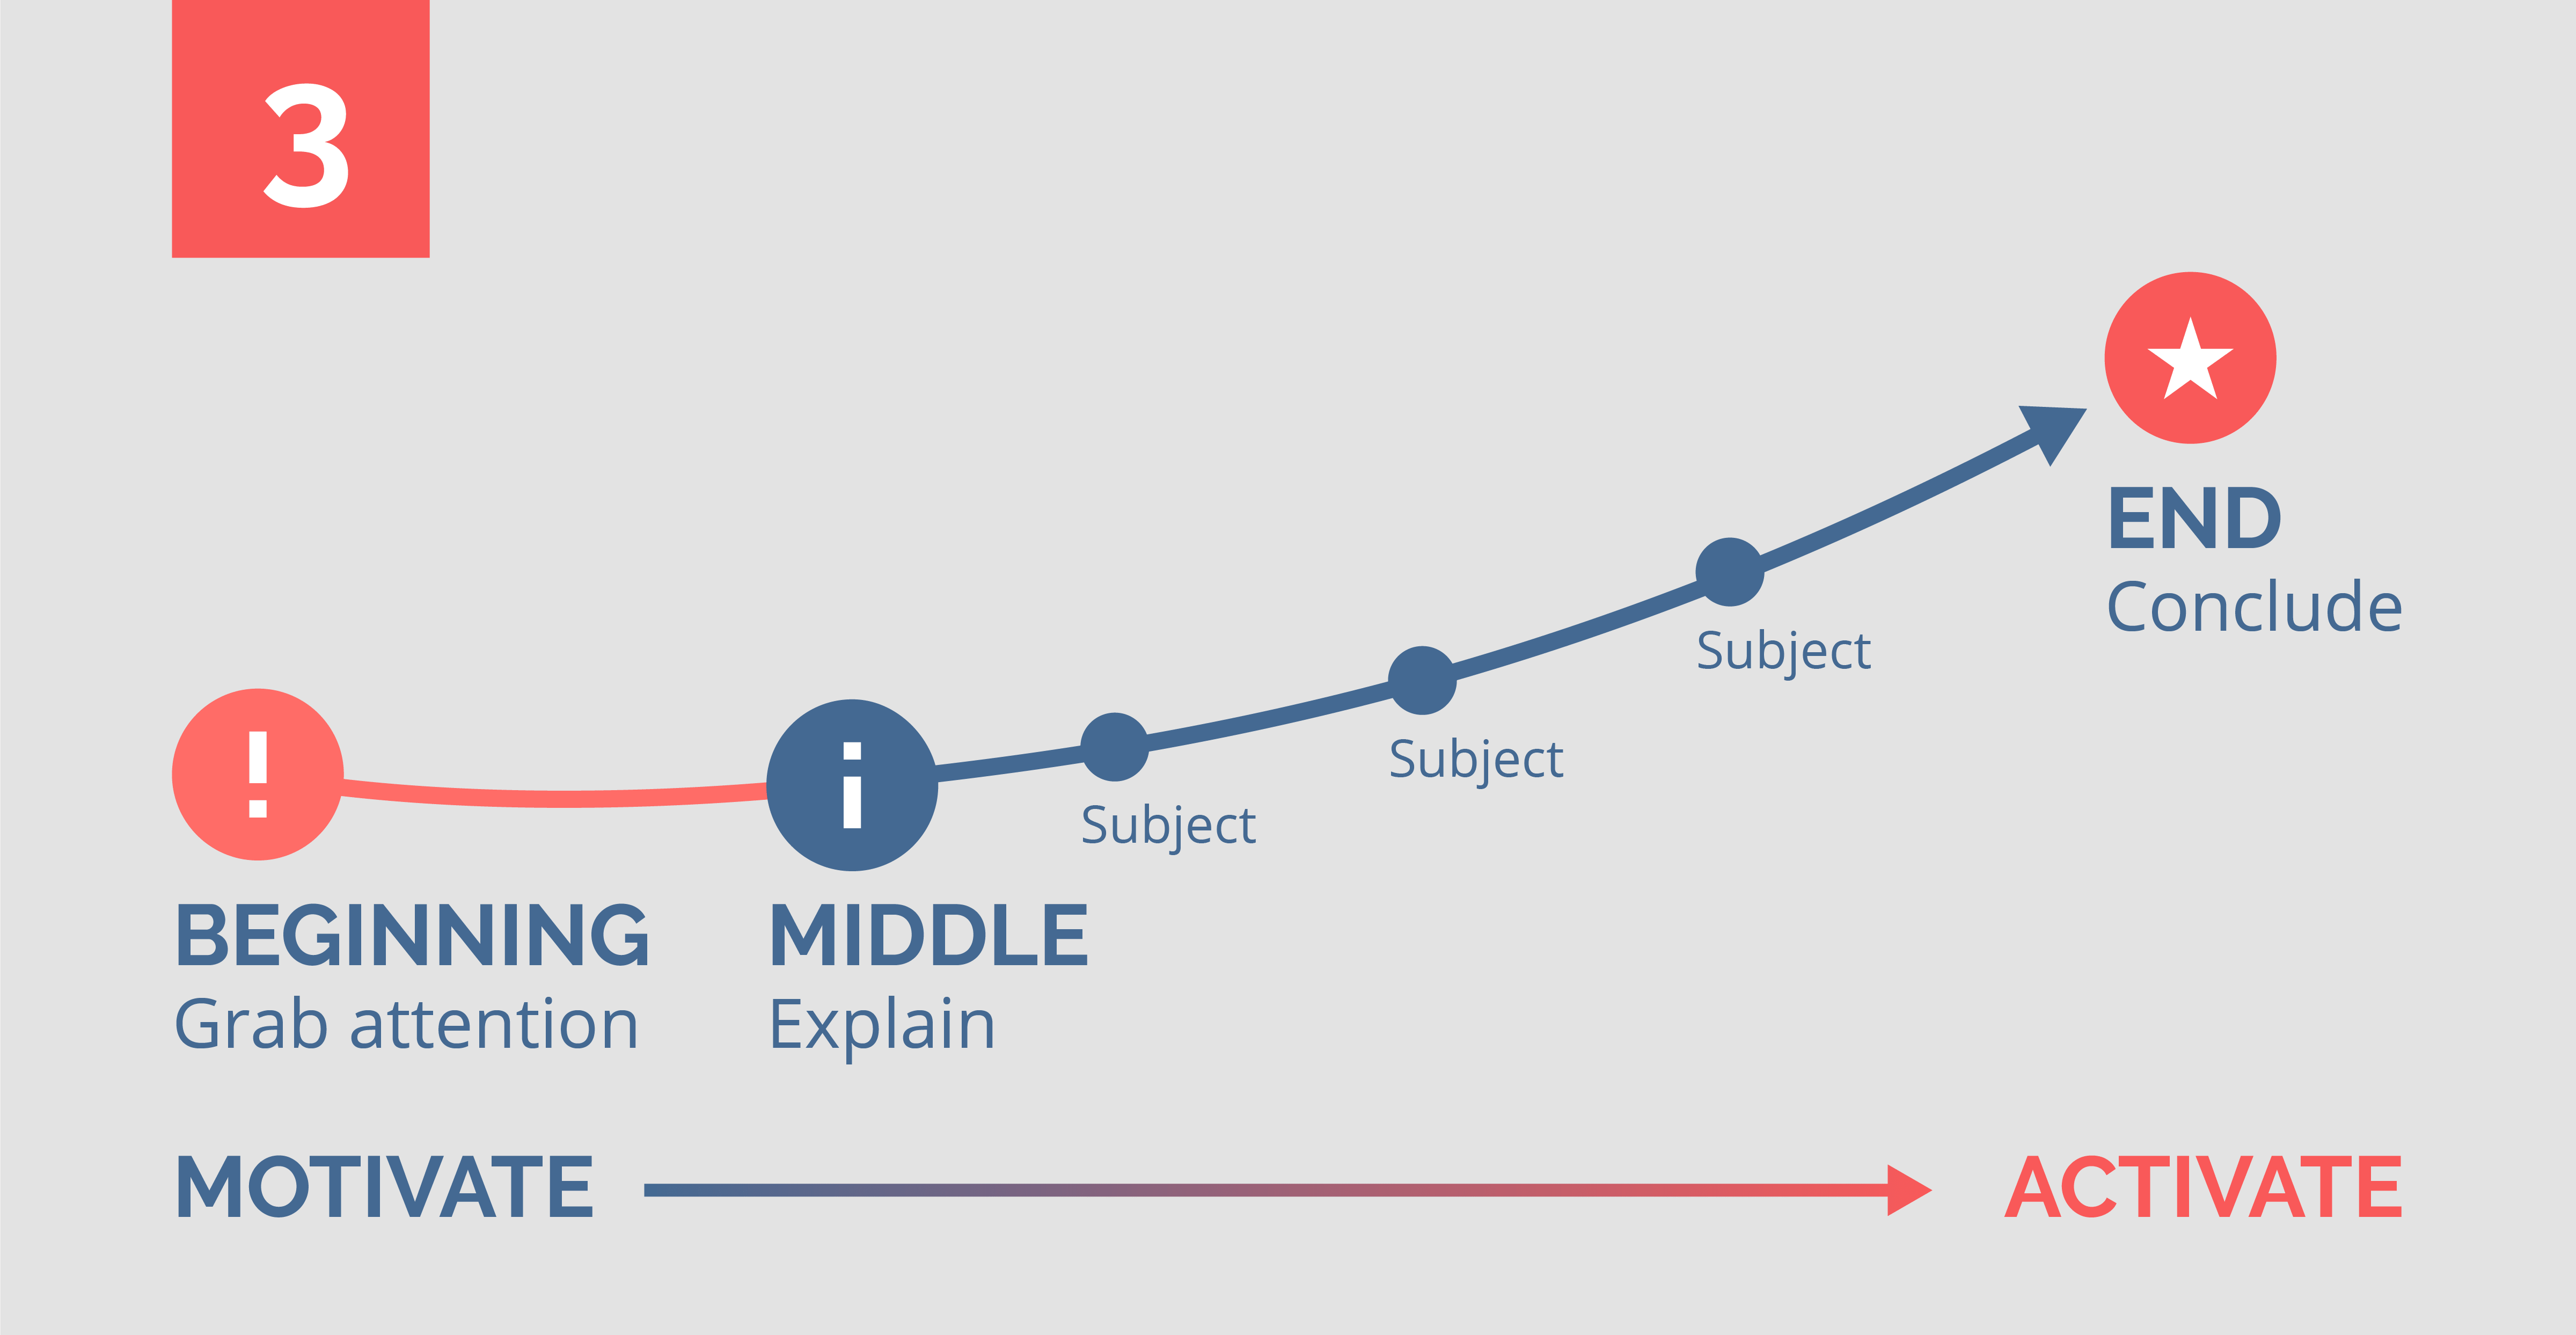
Don't just show facts, figures and data, but tell a story. You can do this using a metaphor or theme, but make sure you don't forget the key message. Bring structure to your story using a three-part story structure (beginning, middle, end).

Choose a strong title
The headline of the infographic is the first thing most readers see. In Addition to being descriptive, the headline should grab the readers' attention and make them want to see the rest of the image.

Make it visual
Try to visualize information as much as possible. Your previously chosen theme or metaphor comes in handy. Most infographis also contain text, but that text should be kept short and to the point. Use it to support the visualizations you use.


Do it yourself...
Do you want to get started with your infographic yourself? There are various online tools with which you can create your own infographic based on predefined templates. Well-known (free) tools are Adobe Spark, Piktochart, Designcap and Canva.

... or have it made!
Would you prefer a tailer-made infographic, tailored to your specific wishes and corporate identity? At Stijlbende we have almost 10 years of experience in developing infographics, data visualisations, fact sheets and animations We are happy to help you!

Laten we samen jouw bedrijf laten groeien
Klaar voor meer leads, hogere ROI en digitale strategieën die werken? Werk samen met onze experts en ontdek jouw volgende grote kans.
Start jouw project